Script Engine Debugger

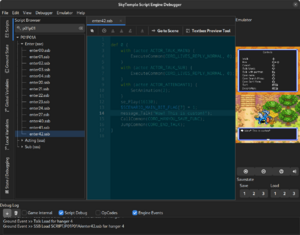
The SkyTemple Script Engine Debugger is an application bundled with SkyTemple that allows editing the game's Script Engine scripts. It has a builtin emulator to test changes made to the game in real time.
The Debugger can be opened from SkyTemple by clicking the ![]() -Icon from within the SkyTemple application. This will open a new window that is split into multiple sections.
-Icon from within the SkyTemple application. This will open a new window that is split into multiple sections.
Menu
At the top of the window is the menubar. This allows you to configure various options, such as emulator controls, script editor color scheme. It also allows you to access utilities such as the "Find & Replace" window.
Sidebar
The sidebar gives you access to various utility functions. By default it shows the "Script Browser" ("Scripts"). Other sections can be accessed with the navigation at the left of the window.
Scripts
The "Script Browser" shows you a directory tree of all scripts in the game. The scripts are associated to scenes and are structured in the same way. Double-clicking a script will open it in the "Script Editor".
Ground State
When the game is running in the emulator and is paused while the Script Engine is active, the "Ground Engine State" view shows a list of all open script files and which hanger they are loaded in. Additionally you can view loaded entities in the current scene. Double-clicking on a script file will open it. The entities in the scene are a combination of all entities from all active sectors of all loaded scenes.
Global Variables
While the game is running the "Global Variables" section shows all game variables. These can be manipulated in real time. They can also be saved and reloaded.
The game variables are the same used by the Script Engine, but they are also used by other parts of the game.
Local Variables
When the game is halted during debugging, the "Local Variables" shows the current values of local variables and macro variables.
State / Debugging
The "State / Debugging" view is split into two sections.
Debug Flags
In the "Debug Flags" section you can modify the game's builtin debug flags ("Debug Flags", "Debug Log Flags") as well as enable general debugging capabilities built into the Debugger ("General Debug").
General Debug
- Draw Entity Debug Overlay: If enabled the Debugger will highlight entities on the overworld in the emulator. This includes invisible entities, such as invisible objects and triggers.
- Enable Debugging Mode: This causes all debug branches in scripts (
if (debug) {...}) to pass, enabling some debugging menus in the script engine, as well as custom debugging capabilities behind debug branches. - Dungeons: Auto Next Floor: If checked and the player is in a dungeon the Debugger will automatically advance the game to the next dungeon floor whenever it's the player's turn.
Debug Flags
- Message Speed Up: Increases the text spped.
- Disable Screen Fade: Disables all screen fade animations.
- Disable Sound: Disables all sound effects and music.
- Disable Background Music: Disables music.
- Disable Sound Effects: Disables sound effects.
- Stage NPC Dummy: Sometimes replaces actors in scenes with placeholder Pokémon. This doesn't seem to actually work most of the time.
- Text Overflow Check: Does nothing.
- No cheat-check: Unknown.
- No plunge-check: Unknown.
- Dungeon Infinite Comeback: Unknown. Potentially removes the rescue limit?
- Enable Debug Menus: Does nothing.
- Override Dungeon Result: Shows a debug menu before dungeons that allows auto-completing or auto-failing a dungeon. Additionally enables a debug display in the personality quiz.
Debug Log Flags
All "Debug Log Flags" enable additional debugging information being written to the log.
Allocated Memory
The "Allocated Memory" section gives you information about allocated memory locations while the game is running and paused. You can dump allocated memory for debugging purposes.
Script Editor
The Script Editor allows you to edit the game's scripts. Instead of directly editing the low-level code, the Debugger will when a script is opened first decompile it into ExplorerScript, a high level scripting language for modifying the game's scripts. The toolbar at the top allows you to control debugging and jumping to the corresponding scene in SkyTemple's main window.
Debugging a Script
To debug a script, choose the line you want the debugger to halt at. Click the small area on the right side of the line number before the actual code starts. This will add a breakpoint, indicated by a red circle.
If you run the game in the emulator and the game gets to the selected line, the debugger will halt and you will be in debugging mode. You can now use the buttons at the top of the editor to advance the emulator line-by-line or resume normal operation until the next breakpoint is hit. You can also use the button on the very left to temporarily disable all breakpoints and run the game without debugging.
Auto Completion
Whenever you beging to type an operation name, a constant or a variable, a little window will open under your cursor and suggest auto-completions. This can help you to find what you need. The Debugger will also provide you with a list of parameters when you are inside of an operation call. If you select a Position Mark you will see a button in this window that allows you to open a visual editor for the mark.
Textbox Tool
By selecting "Textbox Preview Tool" your browser will open a new tab that leads to the textbox preview tool. This tool allows you to visualize textboxes and make it easier to tell how many characters can fit in each line. If you open the tool via the button in the editor, it will link to your SkyTemple instance: If you select a string in the text editor it will automatically transfer to the preview tool. This allows you to preview strings in real time.
Emulator
The right side of the debugger shows the emulator window and its controls.
The emulator allows you to test the game. Most changes you make through SkyTemple and the Debugger are applied in real-time, however note that every change you make will slightly corrupt the game (usually starting with the music). This means from time to time restarting the game will be neccesary, a savestate will not help.
Below the emulator you can control its state and save and restore savestates.
The game is controlled with your keyboard and mouse and/or any connected controller or joystick. Click on the emulator to catch keyboard controls.
Holding the "O" key will by default enable "boost mode". In "boost mode" most debugging functionality will stop to function and the game will run at a much higher speed.
To modify and view the default controls use the "Emulator" menu in the menu bar. You can also configure the firmware language here.
Log
The log at the bottom of the window shows you the game's logging output as well as events related to the Script Engine.
- Game Internal: Print the game's output log.
- Script Debug: Print the output of the script's
debug_Print*operations. - OpCodes: Print debugging information about opcodes processed by the script engine.
- Engine Events: Print whenever the debugger detects script and scene files being loaded and unloaded.
